- Task Name: A text field that represents the name of a project or task. You can enter multiple fields to nest or group tasks into a hierarchy.
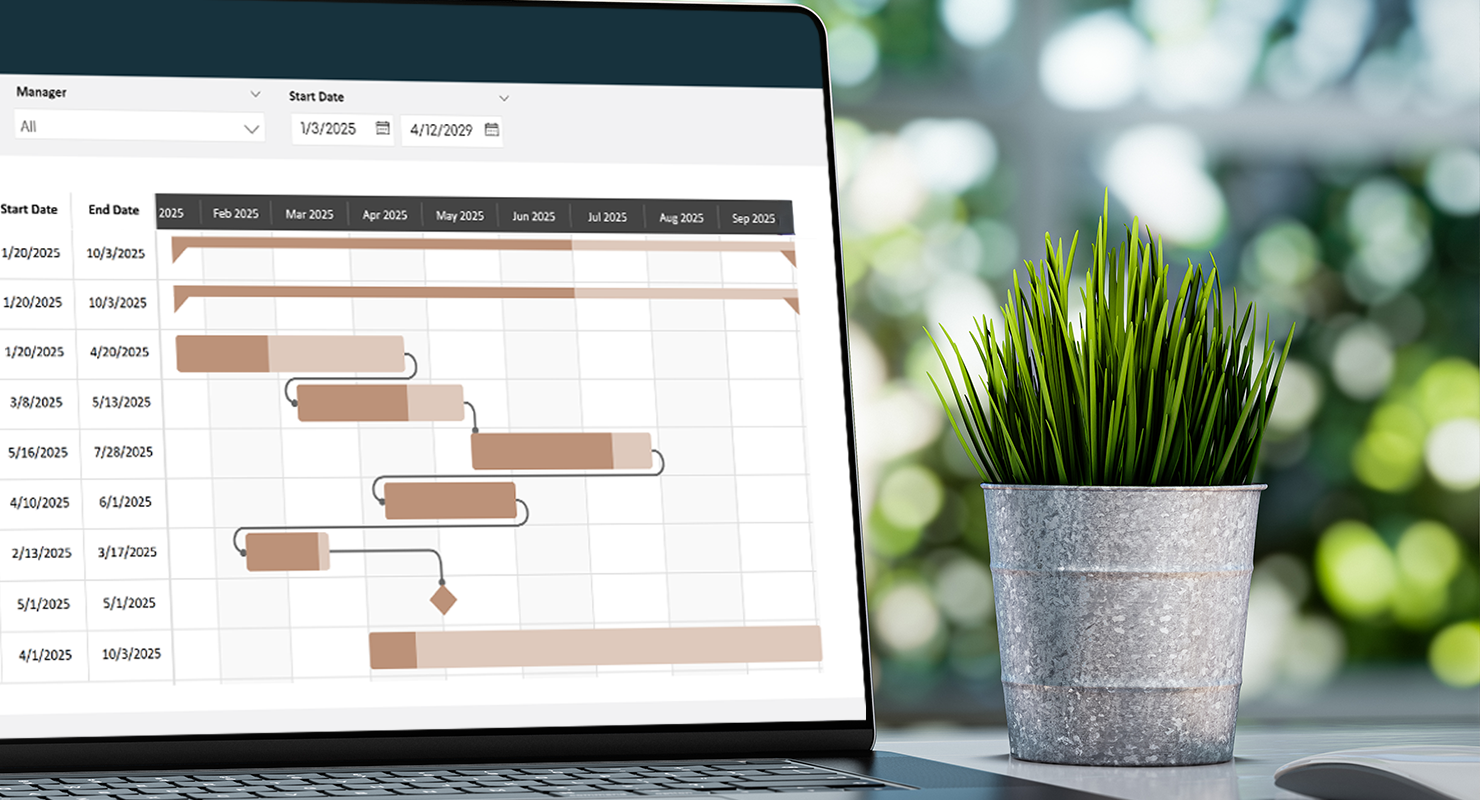
- Start Date: A date field that maps to the start date of the task.
- End Date: A date field that maps to the end date of the task. Note: if your date is not a measure, set this to the ‘Latest’ category in the field well.
Expand and Collapse Tasks Hierarch with Matrix View
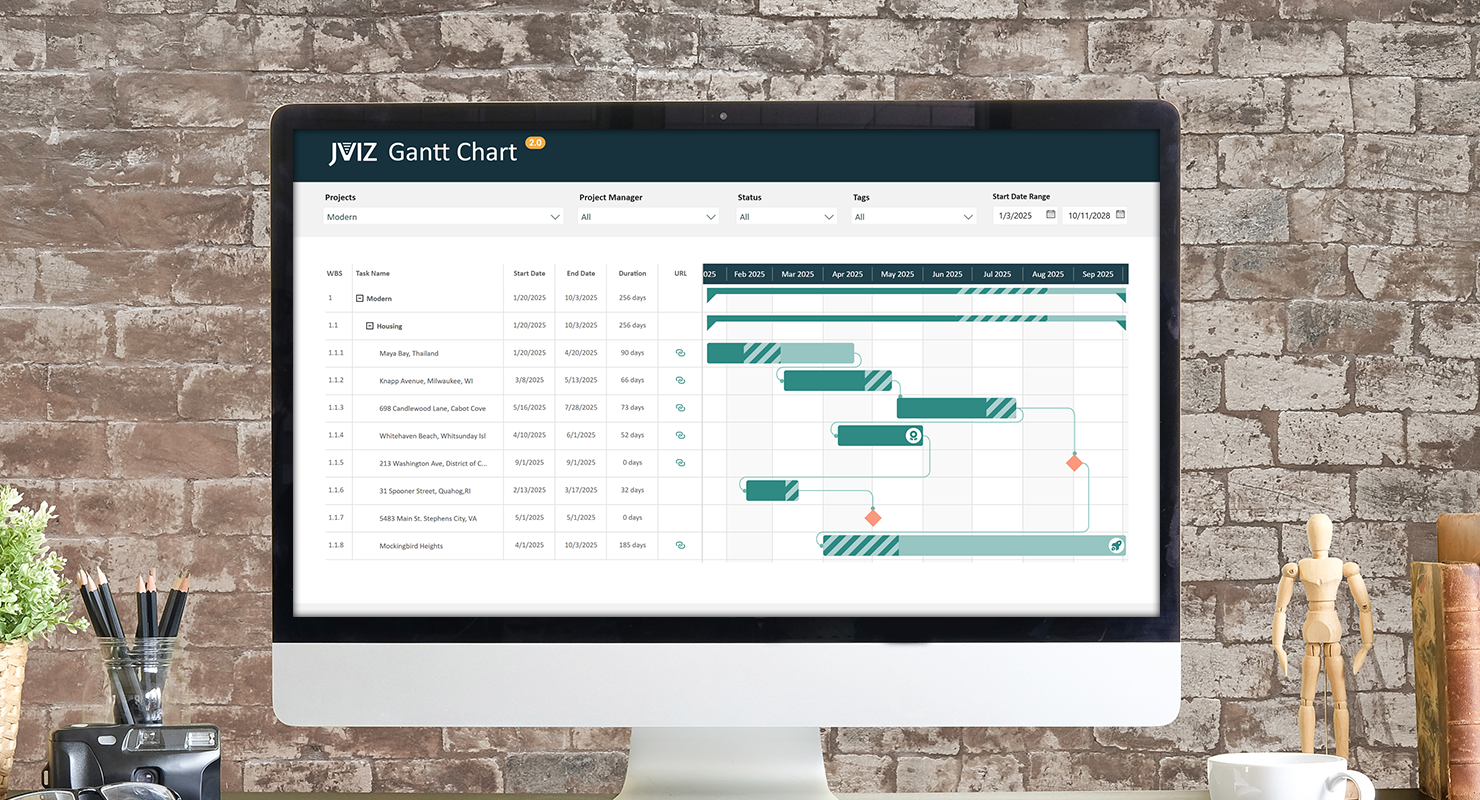
Easily expand and collapse parent and child tasks by toggling the Matrix setting under Layout and Grid. When Matrix is disabled, you will see parent or child tasks one level at a time. This is ideal if you do not have a multi-level task hierarchy. When Matrix is enabled, you will see your complete task hierarchy in an expandable-collapsible view. You can adjust the child hierarchy indentation, and color of the expand/collapse icon. You may also opt to hide the expand collapse icon.
Responsive Scrolling through Timeline
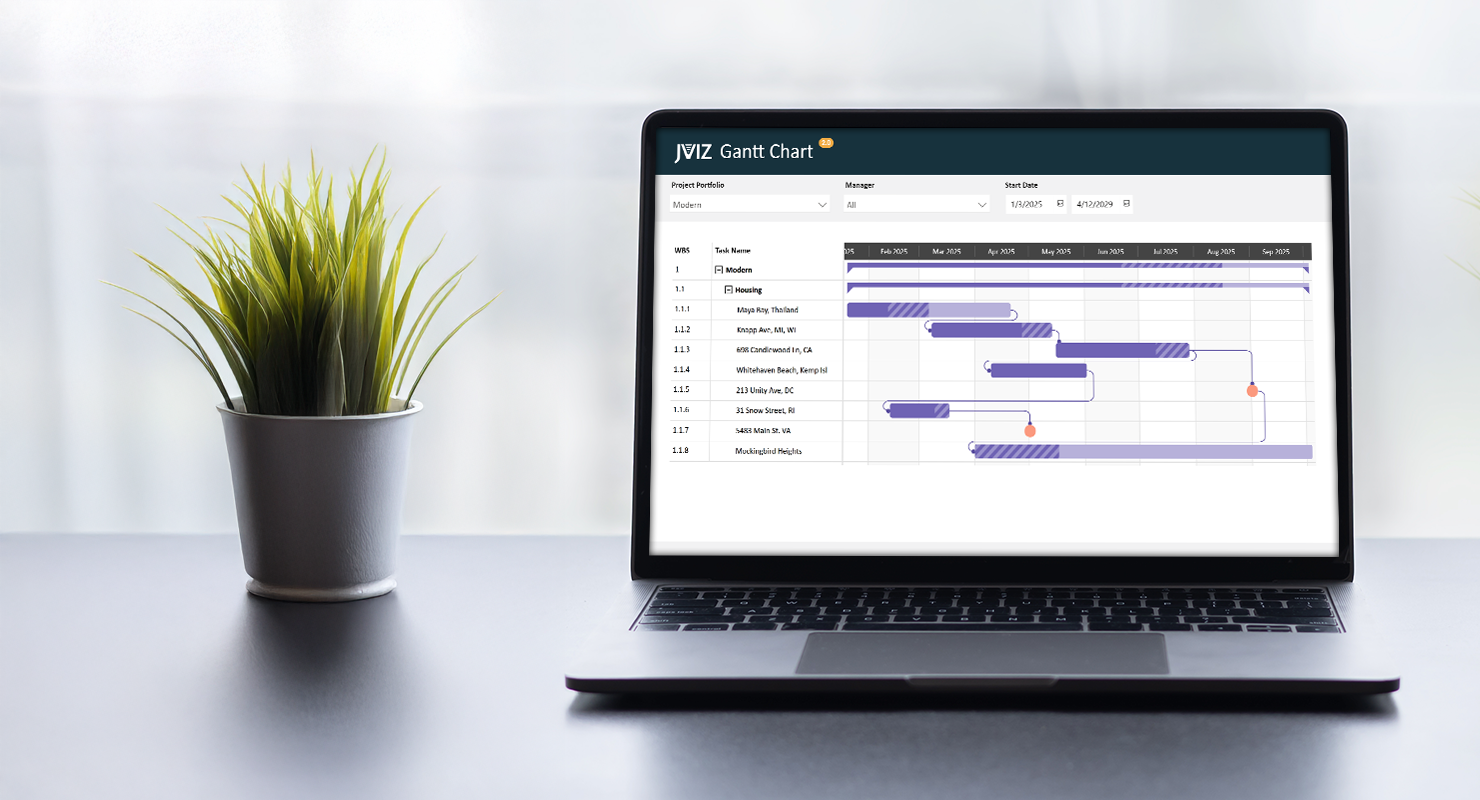
JVIZ Gantt 2.0 does not have a horizontal scroll bar but is designed to be fully responsive based on your task start and end dates. To scroll down into the months, weeks, or day of your task simply hover over the timeline bar, and hold the [Shift] key on your keyboard and scroll up to drill into your timeline. Likewise, hold down the [Shift] key in the timeline, and scroll up to drill out of your timeline. You can scroll left and right on the Gantt chart by, clicking in the timeline and dragging your mouse to the left or right. The experience is fluid and allows you to have interrupted view of your project data at all times.
Styling Design for Parent Grouping
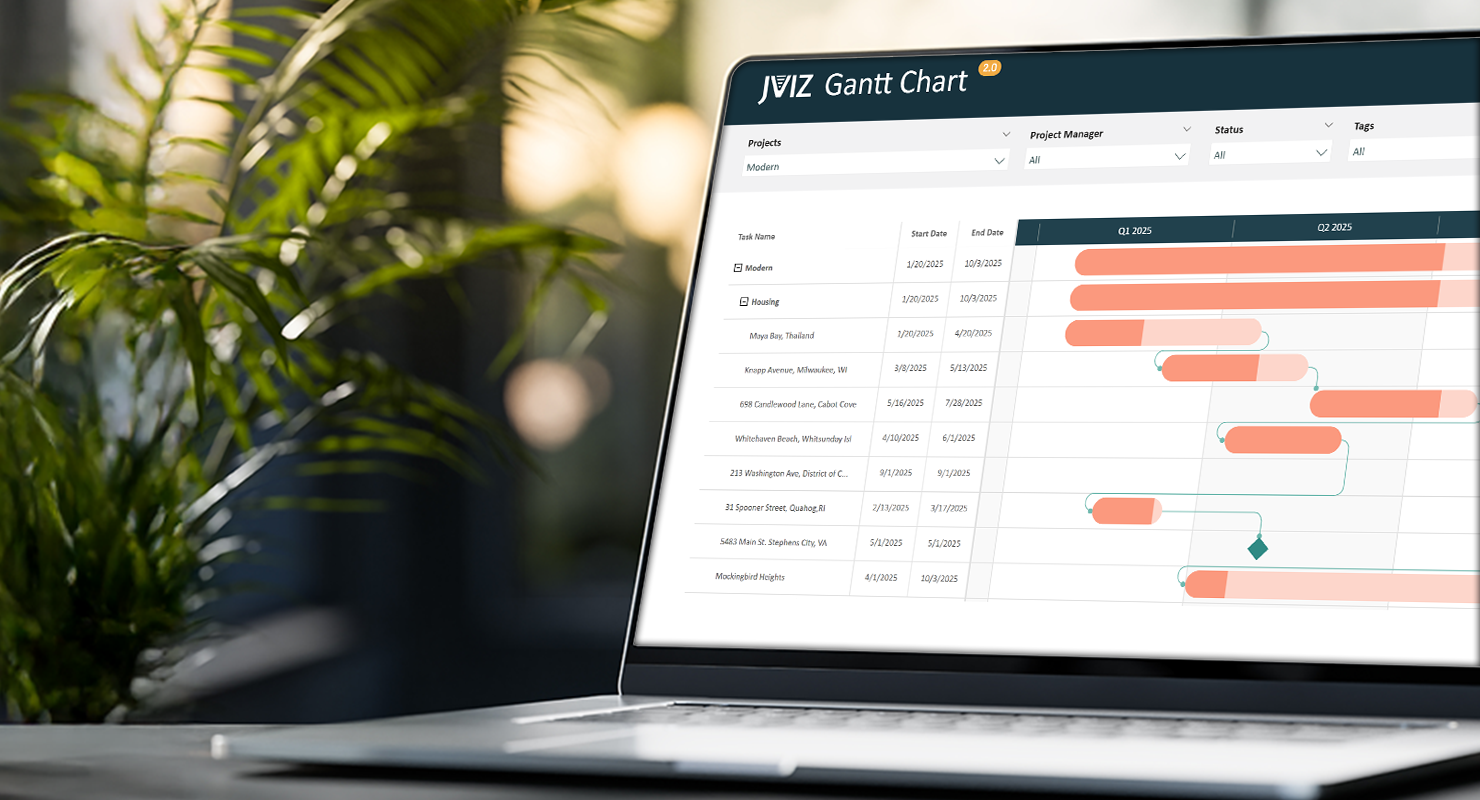
Quickly customize the parent task bar summary display of tasks by toggling the Parent Grouping setting under Bar Style > Bar. When enabled, parent tasks are displayed as a thin bar across the child tasks. When disabled, parent tasks are displayed as a normal task bar across the child tasks. Parent tasks by default aggerate child level tasks attributes depending on min/max settings for start and end date, and percentage complete.