Tracking dependencies between tasks is essential to project management and is now a feature of JVIZ Gantt Chart 2.0. In this article, we will demonstrate how to configure dependency lines in your Gantt Chart, that will help you stay ahead of schedule.
What are Dependency Lines in JVIZ Gantt Chart 2.0
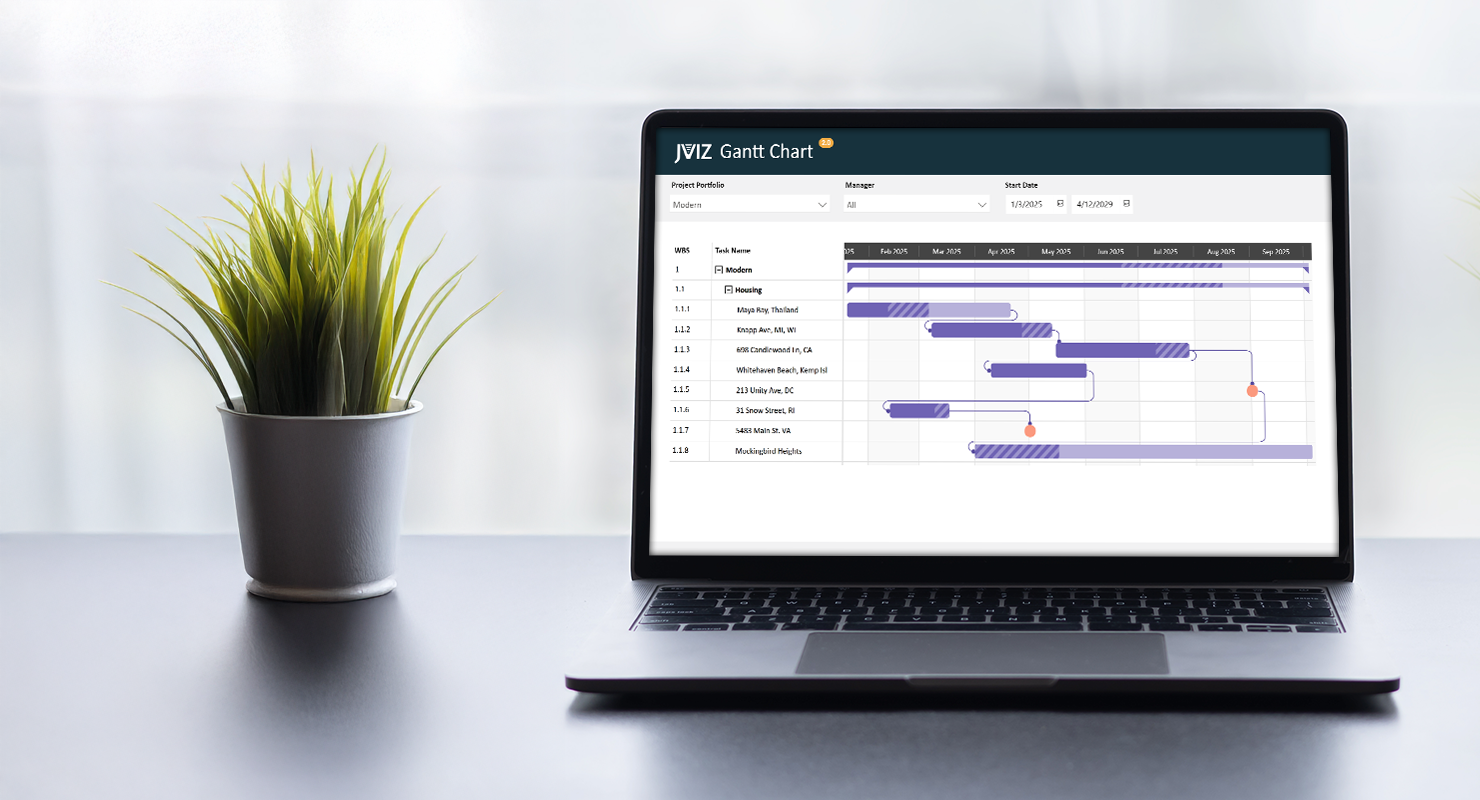
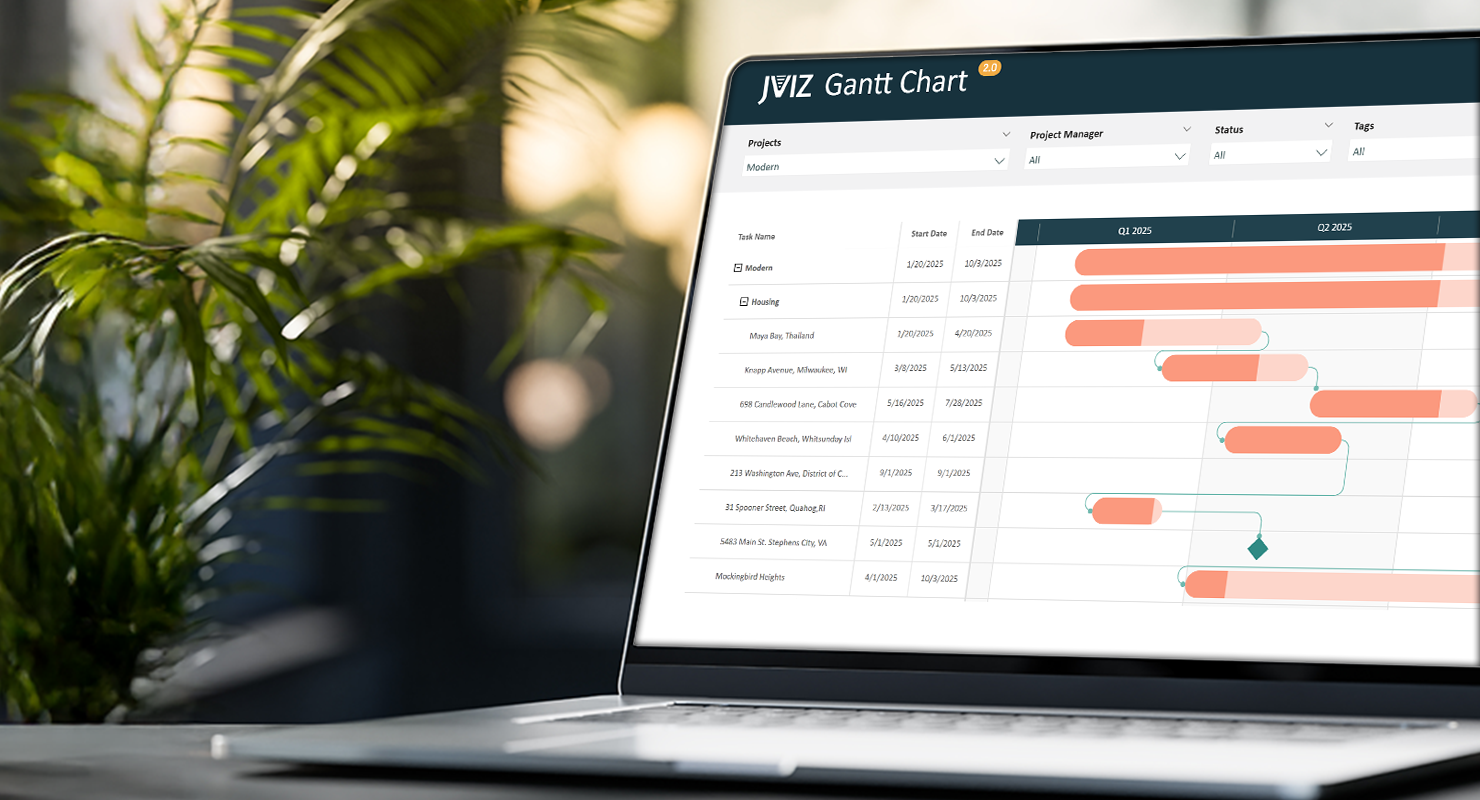
Dependency lines are visual connectors used in a Gantt chart to illustrate the relationships between tasks. They represent the chronological constraints that determine when one activity can start or finish relative to another, which is a fundamental aspect of effective project management. JVIZ Gantt Chart 2.0 allows users to easily plot dependency lines by just supplying some basic information.
How are Dependency Lines Defined
Before we can display dependency lines on our Gantt chart, we need to understand how dependency lines are mapped in JVIZ Gantt Chart 2.0. Dependency lines require two fields to be supplied in the visual field well:
Task ID: The unique identifier for each row in your task hierarchy data table. This represents the lowest level in the task hierarchy and each row at the lowest level must have a unique identifier.
Dependency ID: This should map to the Task ID that any given task row depends on (the predecessor Task ID). In JVIZ Gantt Chart 2.0, a task row can have only one (1), dependency ID.
Updating your Data Table in Power Query
Let’s begin by populating Task ID and Dependency IDs for our tasks in Power Query. To do this, navigate to our data table where we will add two new fields. Hint, before completing the following steps, recommend sorting your table by your task hierarchy fields and/or start date. It will make it easier when we set the dependency IDs.
We’ll name our fields for this example TaskID and DependencyId. You may already have a unique task ID field for each row in your table. If so, you can reuse this field as your TaskID field. If you do not already have a unique TaskID field in your table, then create a new column in your data table and manually fill in the TaskID values starting with the number 1, and then increment on down, one number at a time. When you finish, you should have the same number of TaskID as you have rows in your table. The goal is to ensure each row has a unique TaskID value.
Next, for the DependencyId field, find a few tasks that belong to a related parent project, and set the DependencyId fields to the predecessor TaskID that the row depends on. Do this for a group of projects and save your changes.
Before saving your final Power Query changes, make sure to make both fields whole number fields.
Creating a Measure in Power BI Designer
From here, you could essentially drag the new TaskID and DependencyId fields into the respective field wells. If you do this, you must set the summarization of the field to either AVG, MIN, MAX, or SUM so that it shows the exact value of the TaskID or DependencyId . If you select COUNT or COUNT (Distinct), you will not get accurate dependency mappings. Note: dependency lines only show when the Gantt chart is expanded to the lowest level in the Task Hierarchy.
Our recommended approach is to create a measure with the logic to map to the selected TaskID or DependencyId value.
Fortunately, the DAX code is short and sweet. Let’s create two new measures in Power BI Desktop and paste the code below. Be sure to change the table name and column name to your data table name and column name if you used a different column name than the one used in our example above:
DAX Measure Code:
Task ID = CALCULATE(SELECTEDVALUE(Projects[TaskID]))
Dependency ID = CALCULATE(SELECTEDVALUE(Projects[DependencyId]))
Almost done! We are now ready to drag our new measures into the Task ID and Dependency ID field wells respectively. Make sure to filter your Gantt chart on a set of projects that have dependencies.
Hint: If you do not see the dependency lines appear, ensure you are at the lowest level of the Gantt chart hierarchy.
Dependency Line Styling
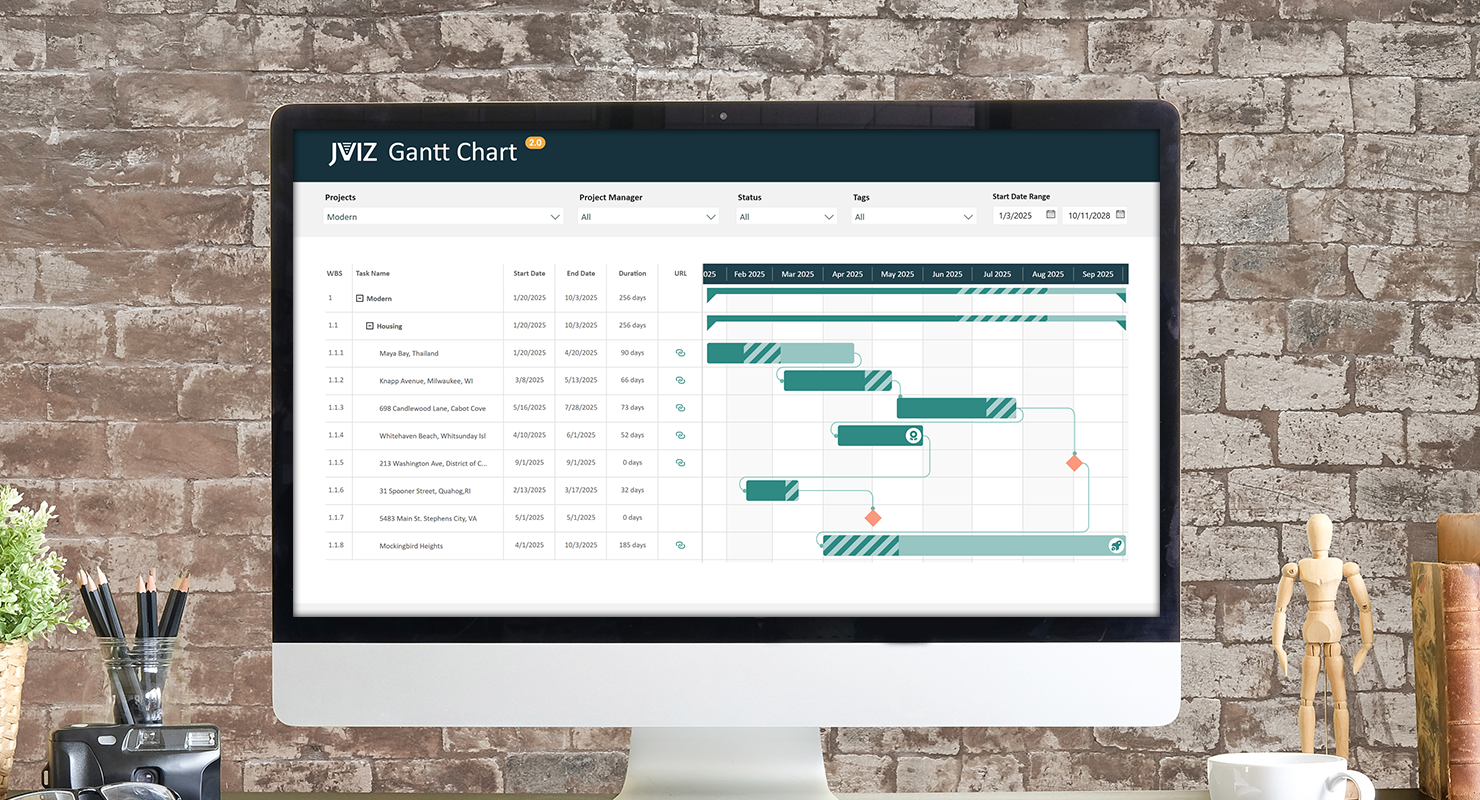
We’re now done with the back-end mapping and can move onto the fun part, styling our dependency lines. To begin, select the Gantt chart, navigate the visual formatting pane, and expand the Dependencies section. From here, we can style the line as curve or angle by setting the interpolation type:
Interpolation Type
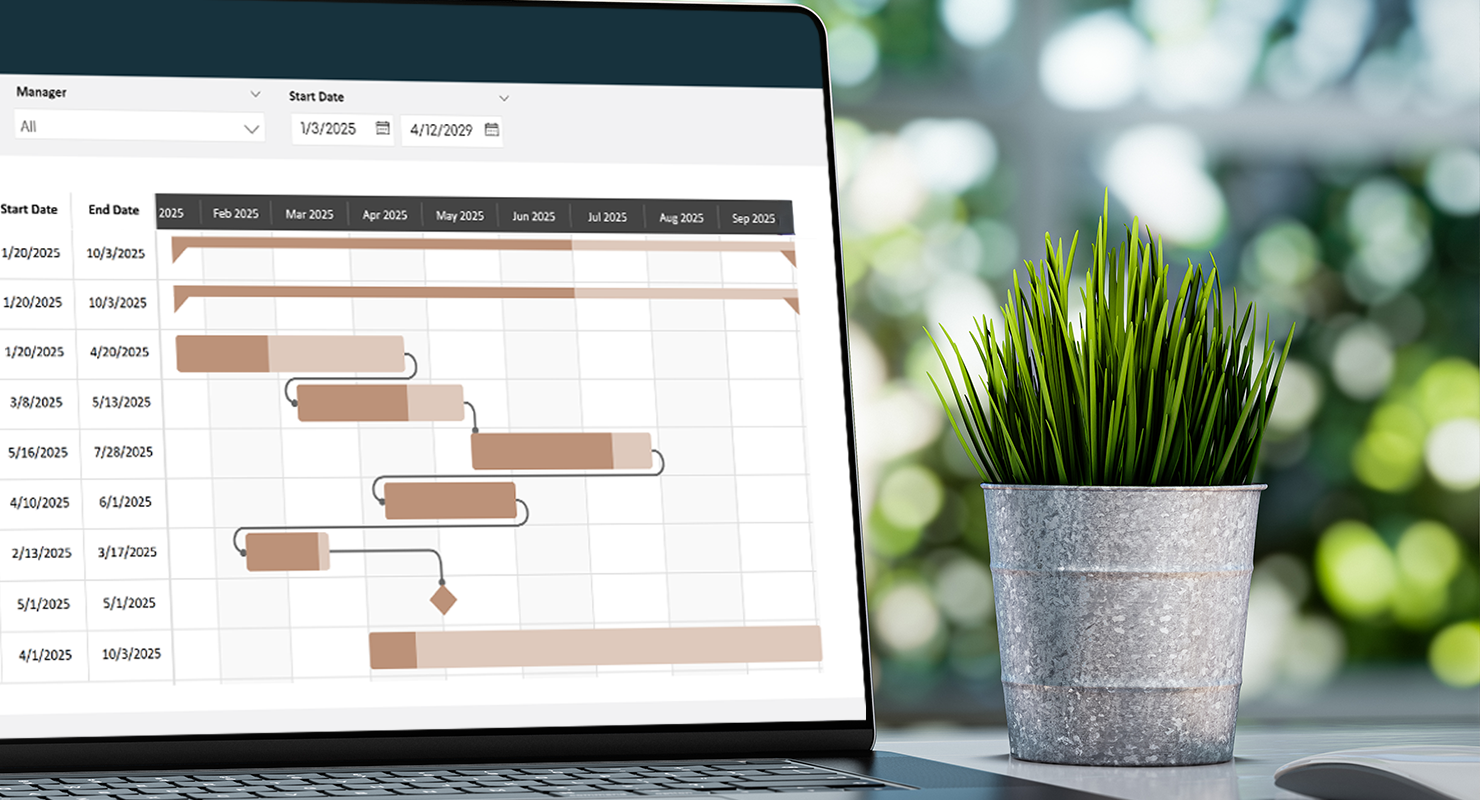
Step = lines bend at 90-degree right angles.
Smooth = lines bend in a rounded curve style.
We can modify the dependency line marker, or end point symbol to make it an arrowhead, circle, square, or triangle shape. Adjust the color of the dependency line by changing the line color and adjust the style of the line to make it solid, dotted, or dashed. You can also change the line cap and line width based on your styling preferences.
Conclusion
That’s it! Your dependency lines should now be displayed on your Gantt Chart and as you scroll down and across your timeline, you should see the same dependencies you defined in your data table, visualized in the chart.
If you ever need to stop displaying dependency lines in your Gantt chart, simply remove the Dependency ID field from the field well. Likewise, you can also update your data table and remove the values from the dependencyId column.
Experiment with the interpolation type and line markers to refine your visualization. Incorporating dependency lines in your Gantt chart is a powerful enhancement that will significantly elevate your presentation and distinguish your Power BI Gantt chart from others.