Exciting news – JVIZ Gantt Chart 2.0 is coming soon to Microsoft (MS) AppSource! You will see new and advanced features that make JVIZ Gantt Chart 2.0 the ultimate Power BI visual for showcasing your project portfolio in compelling ways.
We listened to your requests, and our team took everything in the original JVIZ Gantt Chart and added several new features including:
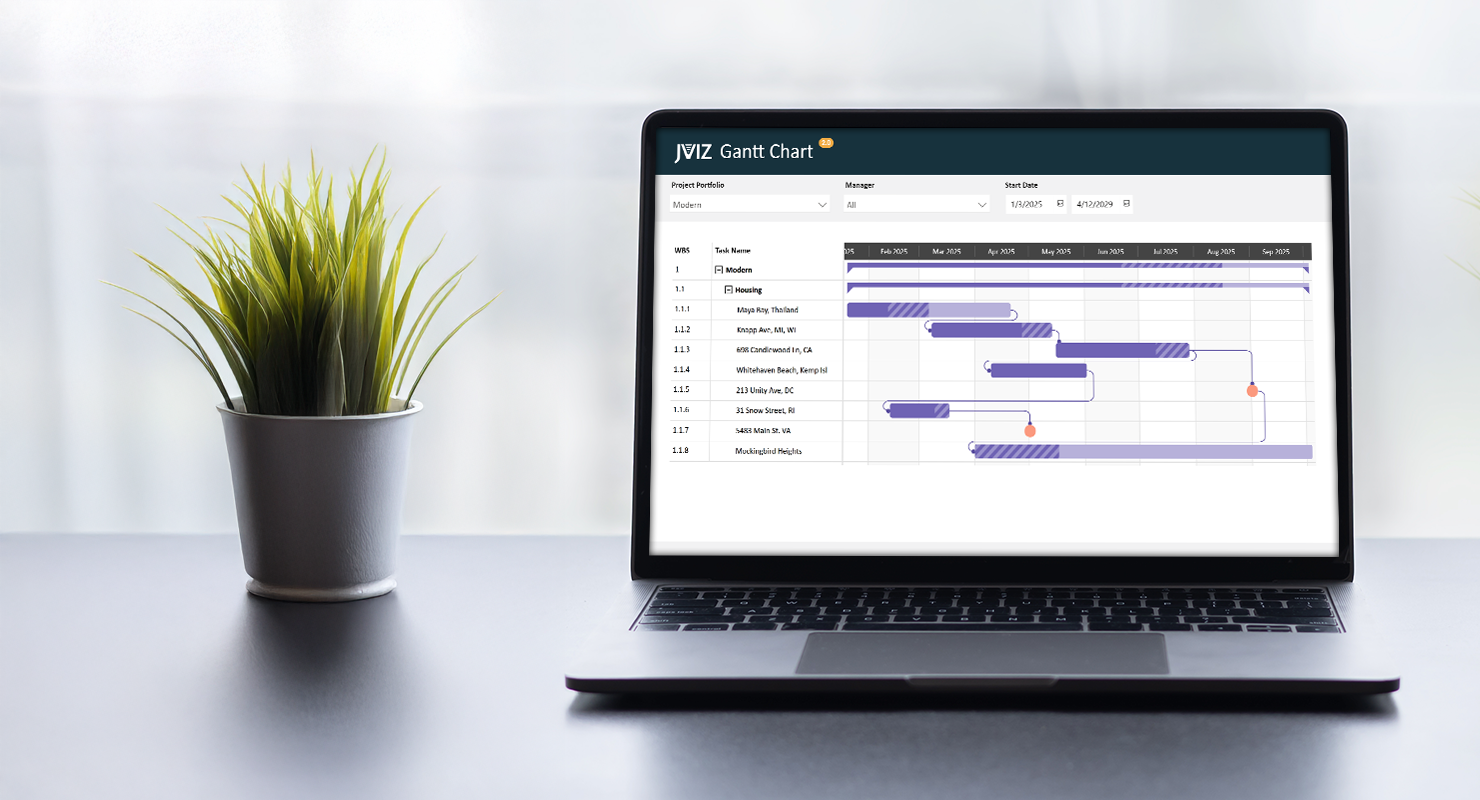
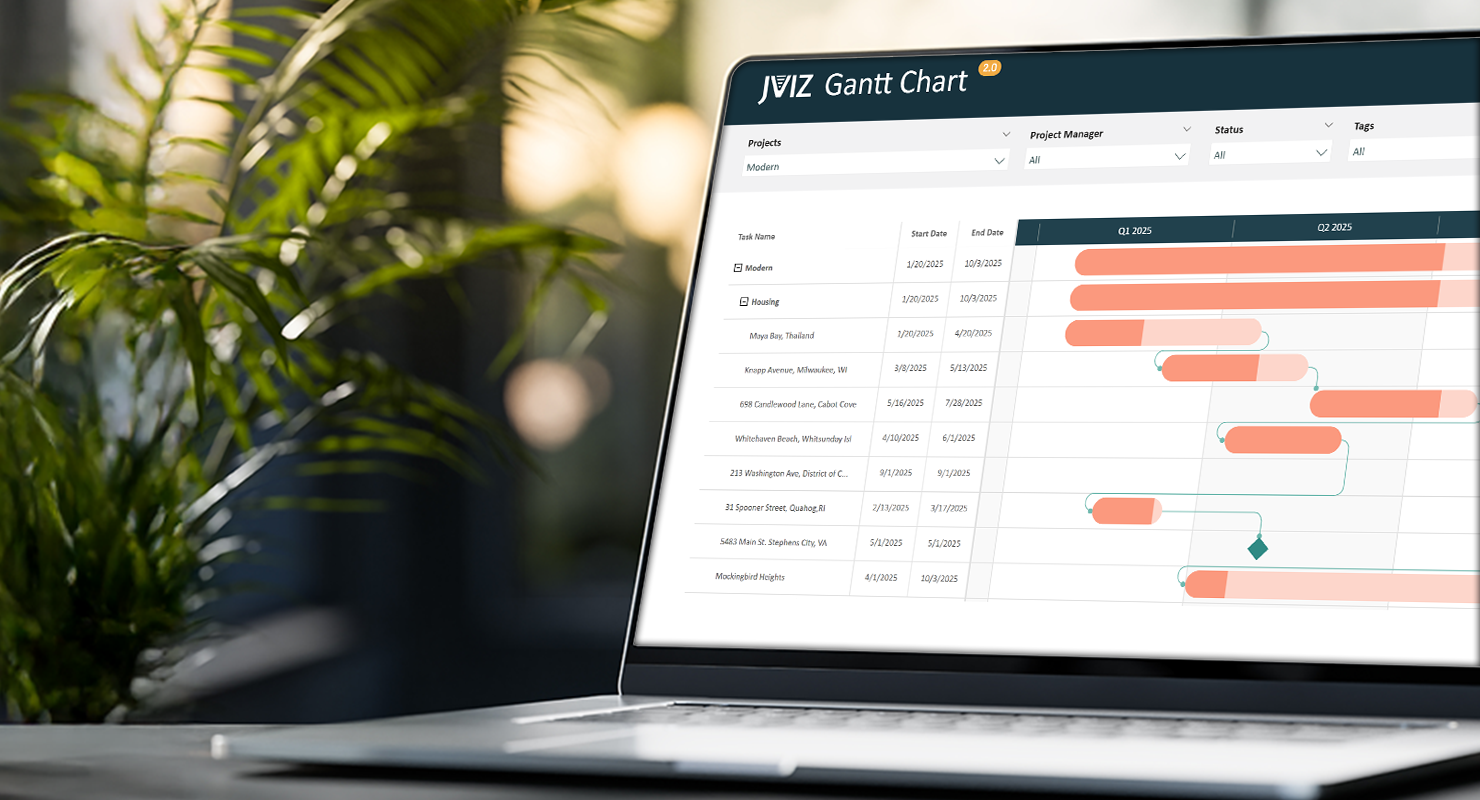
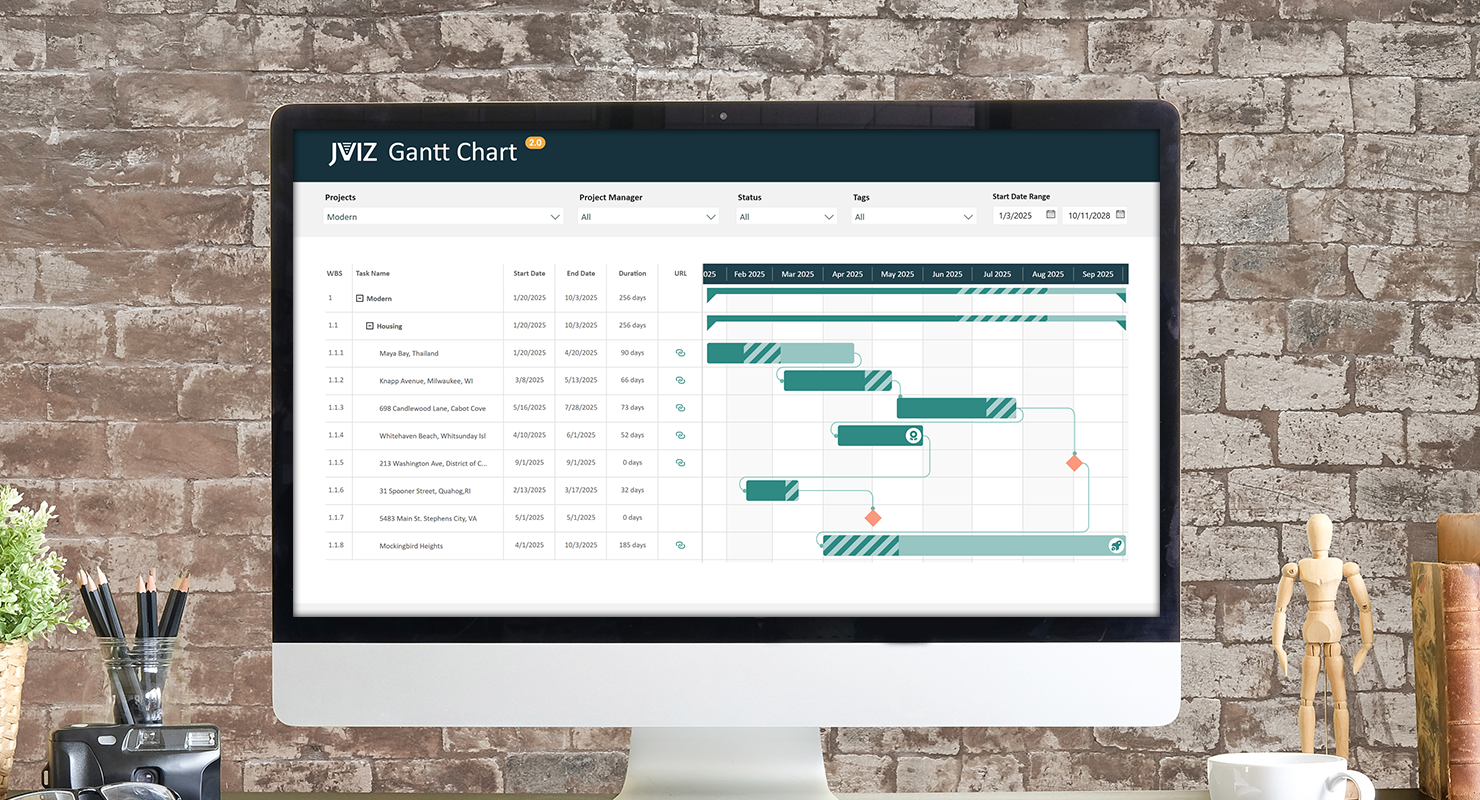
- Collapsible task hierarchy so you can easily drill up and down into your project portfolio.
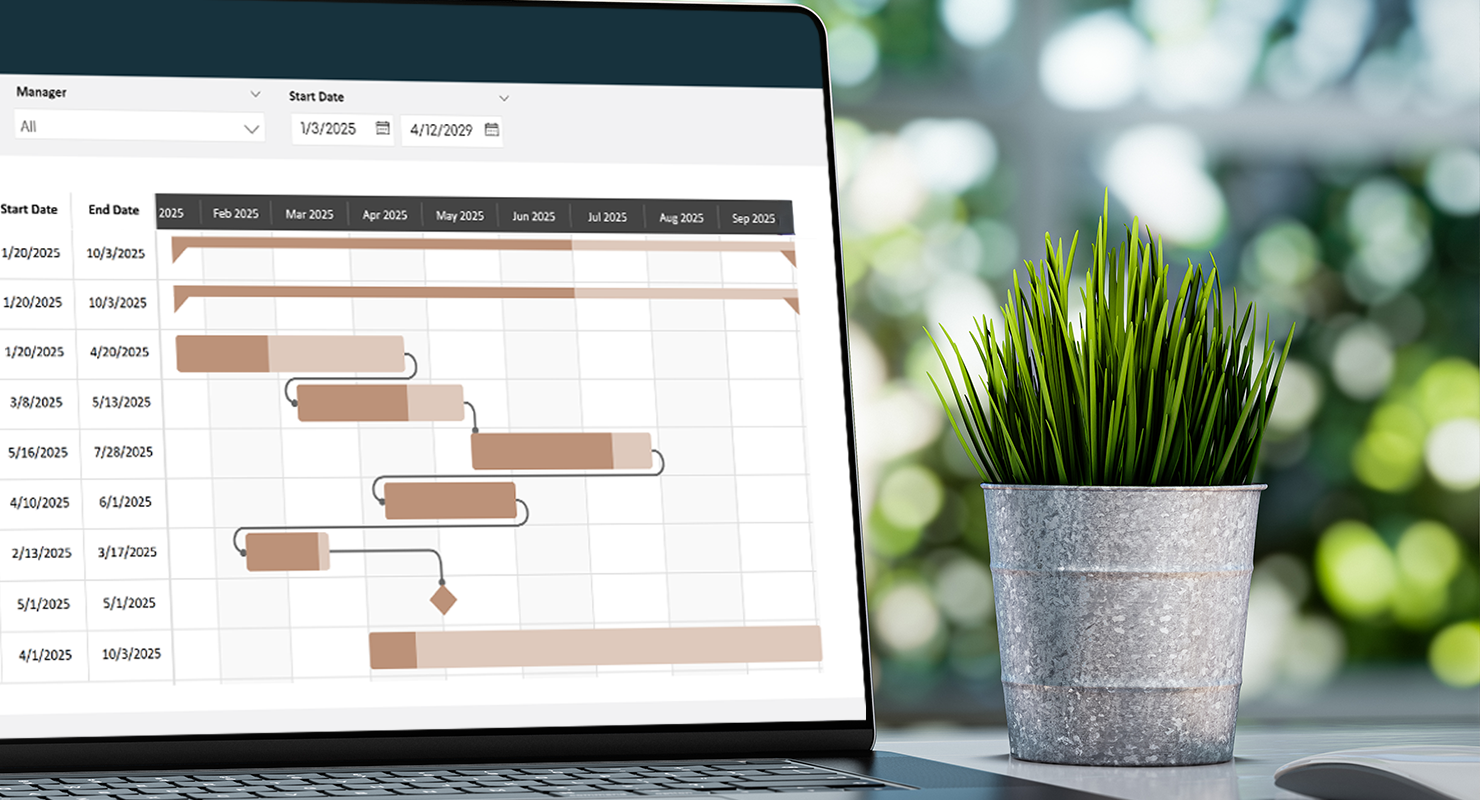
- Dependency lines that link parent and child tasks.
- Milestone tracking using stylized icons.
- Responsive scrolling through timeline that eliminates the needs of horizontal scroll bars.
- Progress tracking over a percent complete range so you can more accurately visualize project completion.
- Conditional task bar icons to quickly categorize or flag certain tasks based on conditional logic.
- Display popular project attributes such as start and end date, duration, work breakdown structure number, and web URL links.
New 3-Tier Pricing Model
JVIZ Gantt Chart 2.0 will include the upgraded 3-tier pricing model. The 3-tier pricing model is based on the number of user licenses purchased through the MS AppSource. Customers can enjoy all the new features JVIZ Gantt Chart 2.0 has to offer, at just a fraction of the cost compared to the original JVIZ Gantt Chart pricing model.
Migrating to JVIZ Gantt Chart 2.0
Beginning November 10, 2025, the original JVIZ Gantt Chart will no longer be available for new purchase in MS AppSource. Existing customers can continue using the legacy JVIZ Gantt Chart until December 31, 2025. Beginning January 1, 2026, all legacy Gantt Chart customers must migrate over to JVIZ Gantt Chart 2.0.