
JVIZ Dot Matrix Documentation
Visual Layout
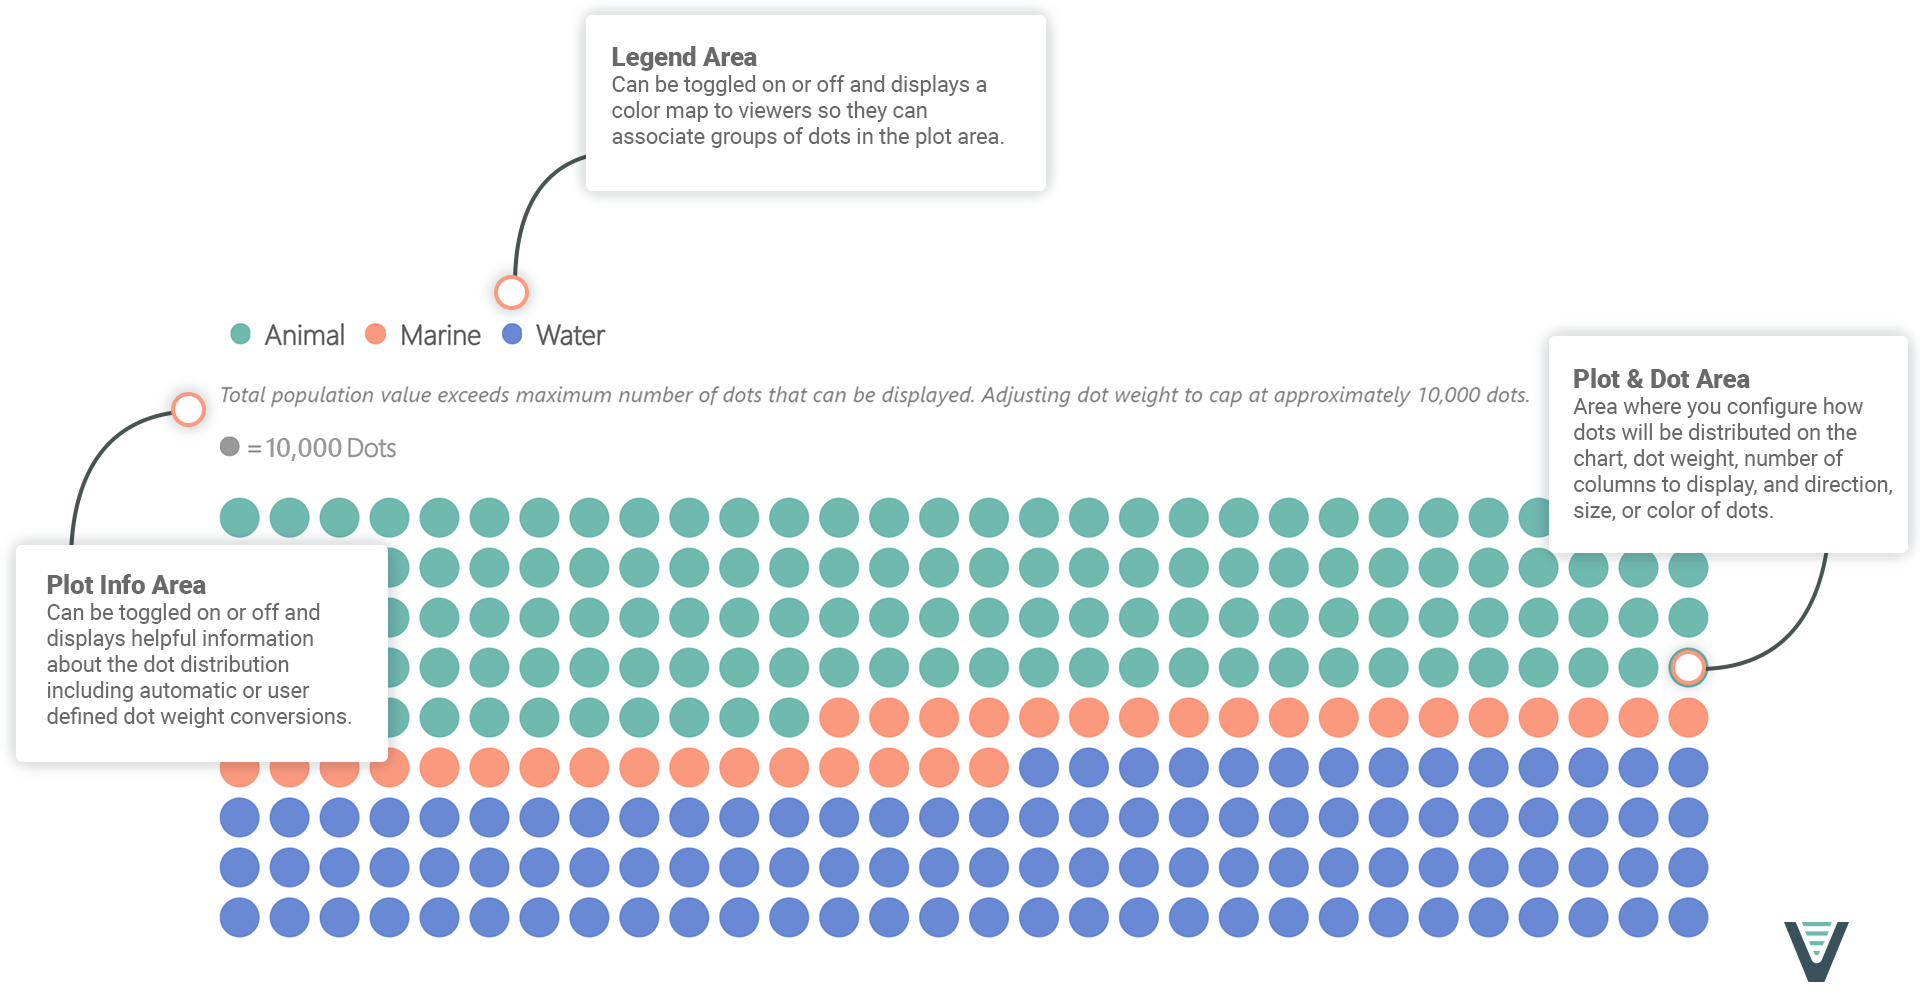
JVIZ Dot Matrix has three sections: Legend Area, Plot & Dot Area, and Plot Info Area.
Visual Fields
JVIZ Dot Matrix has two required fields: Category and Measure.
Category
Maps to a text field to group a series of dots on the chart into categories.
Measure
Maps to a numerical data field to aggregate a series of dots on the chart.
Visual Formatting
Customize the layout of the plot area.
Distribution
Adjust how dots are displayed on the chart.
Proportional distribution is where each category represents a portion of the total population expressed as a percentage. Proportional distribution always adds up to 100% or 100 dots plotted on the chart.
Weighted distribution is where each dot represents an exact discrete value from the population. A maximum of 10,000 dots can be displayed in Weighted distribution. Users can define a dot weight to reduce the number of dots displayed for larger populations.
Dot Weight
How much one dot represents. This setting only applies to Weighted distribution. Dot weight cannot be adjusted for Proportional distribution. Dot weight in Proportional distribution is always set to 1 or 1% of the population. For Weighted distribution, a user can define a dot weight. However, dot weight will be auto calculated if the maximum dots that can be displayed on the plot (10,000) are not enough dots to support the user-defined dot weight. In this scenario, dot weight will be automatically set to the total population value / 10,000.
Columns
Number of columns the dot chart should display.
Default is 1, minimum is 1, maximum is 100.
Plot Direction
Determines in what direction are dots plotted on the chart, there are 4 possible plot directions:
Left-to-Right
Right-to-Left
Top-to-Bottom
Bottom-to-Top
Alternate Plot Direction
Allows you to toggle on the option to alternate or reverse the dot direction when dots get to the end of a row. This allows dot colors to stay connected in block format.
Controls the styling of dots.
Dot Size
Adjust the size of the dot.
Default is 10, minimum is 5, maximum is 100.
Dot Spacing
Adjust the spacing between dots.
Default is 5, minimum is 2, maximum is 20.
Dot Color
Changes the color for all dots.
Dot Roundness
Determines how round the dot shape is. 100 is a complete rounded shape whereas 0 is a sharp edge resulting in a square shape.
Default is 100, minimum is 0, maximum is 100.
Show All Colors
Can be toggled on or off. When toggled off, all dots are the same color as the Dots > Dot Color property. When toggled on, users can select an individual color for each dot using the color picker.
Customize the plot information.
Show Dot Cap
Toggle the display of the dot cap informational text on the chart.
Dot Cap Alignment
Adjust where to align the dot cap information text (either left, right or center of the chart).
Dot Cap Text Formatting
Configure the text color, font family, size, and decoration (bold, italics, underline) for the dot cap text.
Default text size is 13x, minimum is 8px, maximum is 30px.
Show Conversion
Toggle the display of the dot conversion informational text on the chart.
Conversion Alignment
Adjust where to align the dot conversion information text (either left, right or center of the chart).
Conversion Text Formatting
Configure the text color, font family, size, and decoration (bold, italics, underline) for the dot cap text.
Default text size is 13x, minimum is 8px, maximum is 30px.
Conversion Dot Color
Change the color of the dot icon used in the conversion text.
Conversion Text
Customize the conversion text to indicate what each dot represents.
Customize the legend area. Can be toggled on or off.
Position
Adjust where the legend is positioned on the chart. Either top or bottom of the chart.
Text Formatting
Configure the legend text color, font family, size, and decoration (bold, italics, underline).
Default text size is 13px, minimum is 8px, maximum is 30px.
Show Title
Toggle option to show legend title.
Title Text
Customize the legend title text.