

JVIZ Gantt Chart 2.0
The next level of project management.
- Everything in the original JVIZ Gantt Chart and much more!
- Visualize task completion by percent range.
- Select from a library of custom icons for tracking tasks and milestones.
- Track dependencies across related tasks.
- Responsive zoom to drill down into timeline.
- Manage visibility of project attributes and external links.
Visual key features
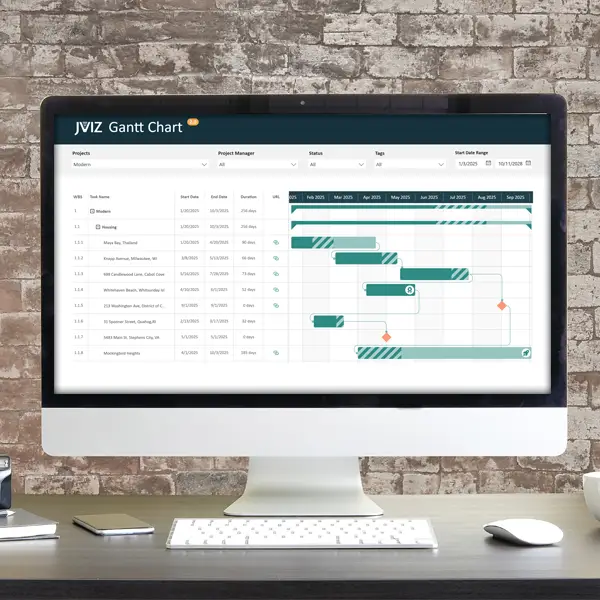
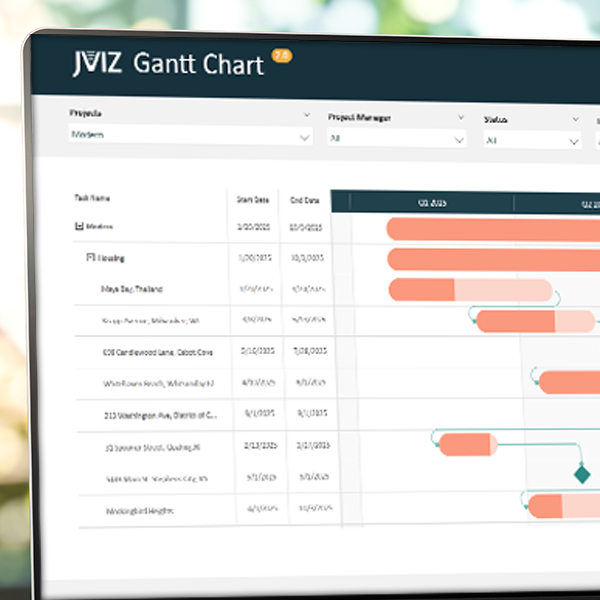
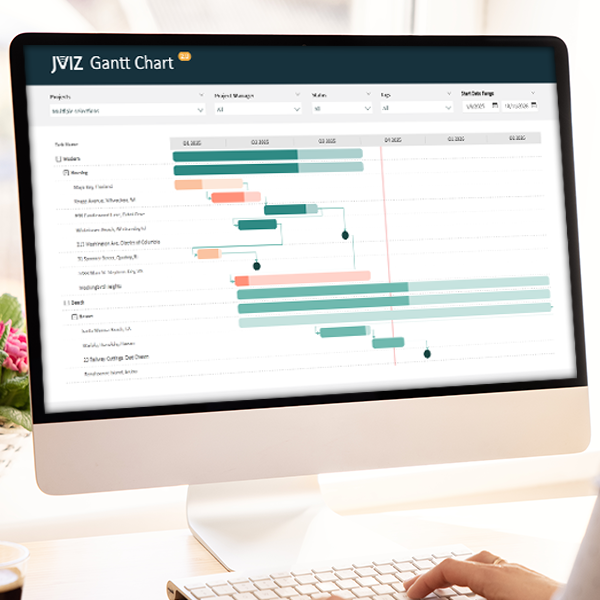
JVIZ Gantt Chart 2.0 features several new enhancements that will position your dashboard ahead of your peers and make your team shine. Below are a few featured enhancements. For a full list of enhancements, see our demo or view the JVIZ Gantt Chart 2.0 Documentation.
Bar Icons
Style your bars with icons and indicators.
Responsive Timeline
Quickly zoom in and out of your timeline.
Enhanced Hierarchy
Expand/collapse projects and tasks.
Progress Range
Track task completion by percent range.
Dependency Lines
Create dependencies between tasks
Track Milestones
Visualize project milestones.
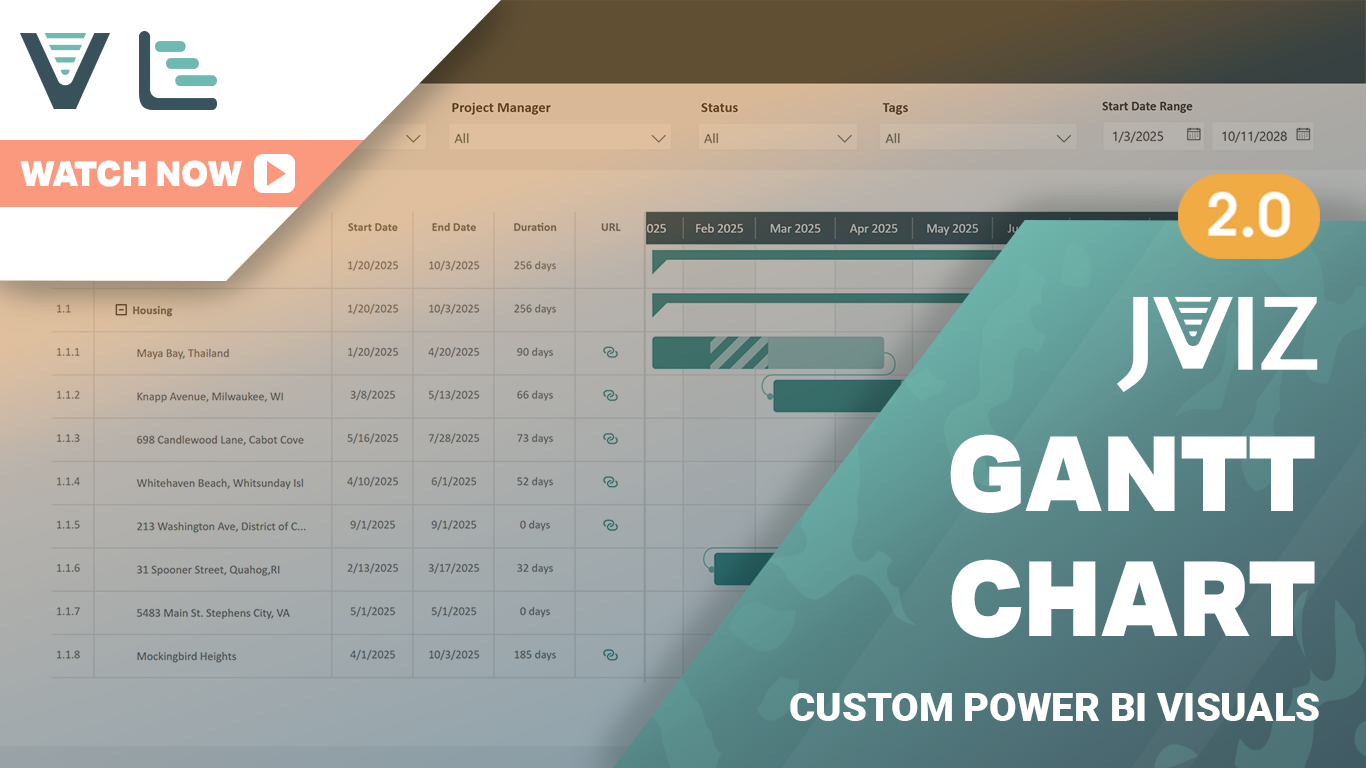
Watch a demo
See JVIZ in action by watching a quick the demo of key features and capabilities. From responsive timelines, dynamic task icons, milestones, interactive hierarchies, and dependency tracking, finally, the long awaited reboot to JVIZ Gantt Chart is here and coming to MS AppSource soon! JVIZ Gantt Chart 2.0 also features our new affordable pricing model so all organizations, small and large, can create compelling Gantt Charts.